Ok, so you have built an application which you believe is perfect. It runs nicely on your device, but does it work just as well on another? Is there any way to verify quality of your app so that you can ship something you can be really proud of? Read on to find out.

Make your great application perfect with Google Lighthouse
As children, we have to live a life full of lies and deception. No matter what we do throughout our childhood, our parents and relatives will tell us it’s beautiful. Draw an ugly dog - “what a painter!”. Make a lemonade of sour milk, cucumbers and herring - “tasty shit!”. Shed a bucket of sweat after managing one push-up - “you’re such an athlete!”. I’ve gone through a lot of mom’s “who-cares-about-muscles” while I was a kid.
We grow up, honestly believing that we are geniuses and everything we do is nearly perfect. Then, slowly but steadily, the world outside starts revealing the painful truth to us. The outcome? Denial, anger, depression, alcoholism, early death. Or, if you are lucky, just alcoholism.
Those of us who won the life’s biggest jackpot and became web developers, face a similar issue while creating our web sites and apps.
Let’s say you built what you think is a Progressive Web App. (If by any chance you are still not aware what a PWA is, then please start off by reading our into article on the subject and blog series describing the process of building one cool progressive app). For a web application to be considered progressive it has to comply with a number of requirements. Some are mandatory, like implementing a service worker and manifest file, while others are needed to improve the user experience, like performance and accessibility. Some of the problems you won’t even be able to notice during the development phase since they are only discoverable on slow network or when browser client has some specific setup, like disabled Javascript.
So how do you know whether your application is good enough? How do you know if you have everything in place before you release it? What if you left out some important ingredients which could’ve made the entire product a real masterpiece? Enter Lighthouse, a strict but fair consultant, brave enough to tell you that your app sucks. It will perform several important audits of your page and give you a detailed score and report in each category so that you could work on improvements. You can save this report for later use or share it with your team members.
Lighthouse is an open-source project developed by Google which originally existed only as a plugin to Chrome browser, but as of now is also available as a CLI, an NPM module (making it possible to integrate audits into your build) and - most importantly - as a built-in tool inside your Chrome browser’s DevTools console (the “Audits” tab).
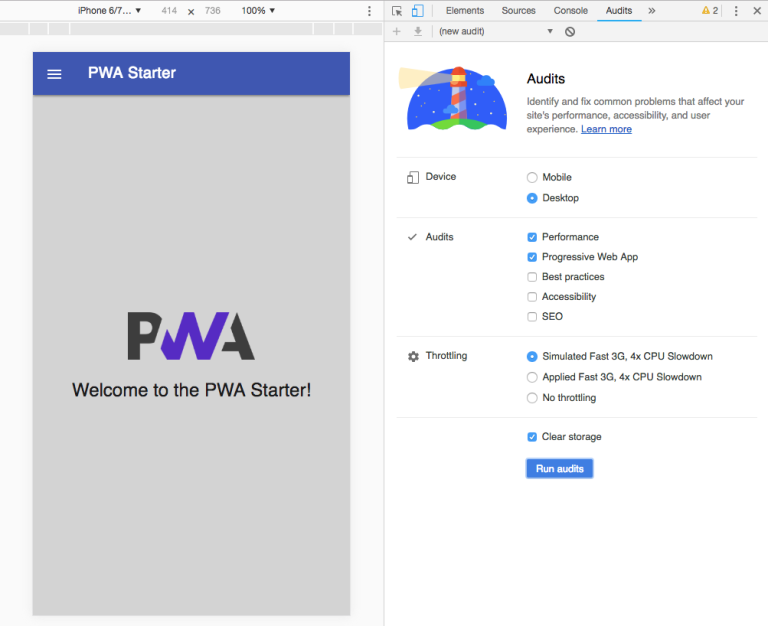
Lighthouse verifies your app in 5 categories - Performance, Progressive Web App, Accessibility, Best Practices and SEO - and gives you a score between 0 and 100, where 100 is the highest possible. When you’re about to perform an audit, you choose one or several categories you’re interested in and Lighthouse will give you a score in each selected category, as well as total score for the entire app. Needless to say, you should aim for all 100s!
At the moment of writing a brand new version 3.0 of Lighthouse has just been released and now you can choose not only which audits you want to execute but also select target device type (Mobile/Desktop) and - awesomely - throttle bandwidth to simulate slow connections.
If your app is not a PWA then obviously you shouldn’t bother with the “Progressive Web App” category, or, if you’re a SEO manager then you can focus only on “SEO” category etc. However, I urge you to always audit Best Practices and Performance. Suggestions that Lighthouse gives you in the Best Practices category will help you become a better developer. And performance… According to my wife, one can always improve on performance (not sure what she meant by that).
In this article we will focus on audits in the Progressive Web App and Performance categories.
Progressive Web App audits
Checks in this section are mostly based on the PWA Checklist. While most of the checks are automated, there are some that cannot be verified by Lighthouse, like for example checking that your app works cross-browser. These you will have to test manually.
If you run Lighthouse’s PWA audit on a non-PWA app then you will get something like this:
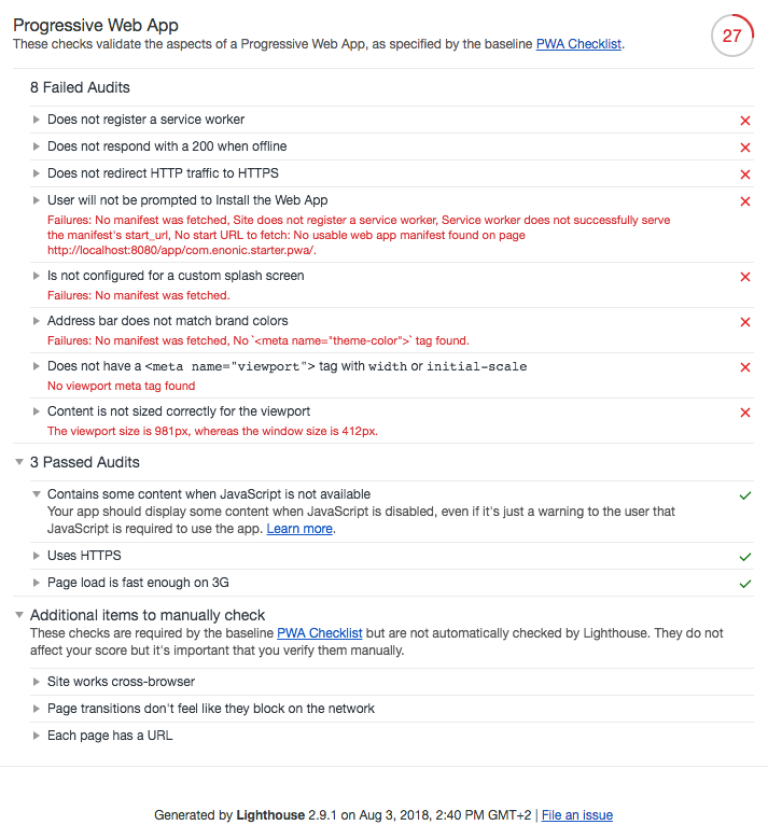
As you can see, my app passed 3 audits in the “PWA” category out of the box:
"Contains some content when Javascript is not available”
If this audit failed, it means that browser with disabled Javascript won’t be able to render any meaningful data on the page. In other words - avoid rendering page content with Javascript. Also, if functionality of your app heavily relies on Javascript, it makes sense to give user a meaningful message about that:
<noscript>
<p id="js-disabled">Javascript is disabled.
<br>
PWA features of this application are not available.</p>
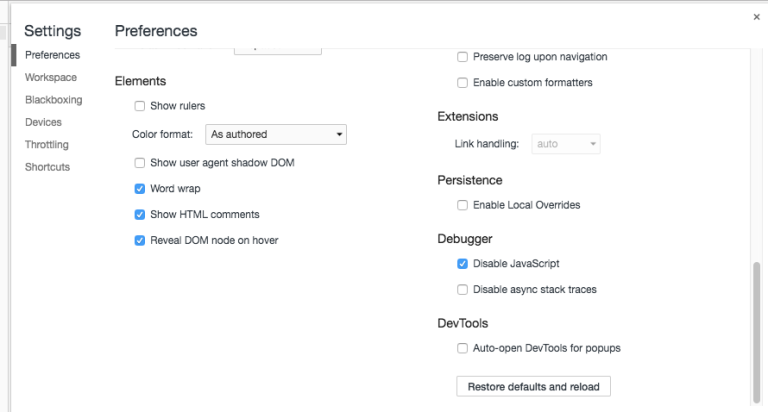
</noscript>Elements between the <noscript> </noscript> tags will only be visible when Javascript is disabled. You can test how your app behaves with disabled Javascript by turning it off in browser settings - press “F1” from the DevTools panel and check off “Disable JavaScript” in the “Debugger” section, then reload the page.
“Uses HTTPS”
This will always pass as long as you’re on localhost, but if your app is deployed onto production server then it’s crucial that HTTPS - and ideally HTTP/2 - is set up on the server. If not, Service Worker will simply fail to register since running under HTTPS is one of the requirements to a Progressive Web App.
“Page load is fast enough on 3G”
More about this later.
Now let’s look at the failed audits:
“Does not register a service worker”
“Does not respond with a 200 when offline”
These two have the same reason. If you are developing a Progressive Web Application, you must make sure your app has a service worker. If you don’t know what service worker is, read this introduction from Google.
In a nutshell, Service Worker is a programmable Javascript proxy that indefinitely lives in a separate process of your browser and - if you program it to be smart enough - makes sure that your application delivers smooth user experience, even when client is offline. It does that by caching static assets and entire resource requests, reacting to browser events and using numerous available Web APIs.
“User will not be prompted to Install the Web App”
“Is not configured for a custom splash screen”
Again, these three issues are caused by the same problem - the lack of Web Manifest file. Web Manifest is a simple JSON file that describes the look and (more or less) behaviour of your application on a mobile device: name, description, orientation, colour theme, start URL, icons for different device resolutions etc.
If you’re a newbie to PWA, I suggest you read our own article that covers the basics and also concept of Service Worker and Web Manifest.
Simply by implementing a basic Service Worker and Web Manifest you can significantly improve your app’s audit score in the Progressive Web Application section.
“Address bar does not match brand colors”
Add a meta tag to <head> section of your page and make sure it matches theme colour you defined in the Web Manifest. This should roughly (or precisely) match colour of your app’s header.
<meta name="theme-color" content="#FFF">
“Does not have a <meta name=“viewport”> tag with width or initial-scale”
Adding the meta tag below will solve this.
<meta name="viewport" content="width=device-width, initial-scale=1.0"/>
This will basically tell the browser client that your application is compatible with mobile devices.
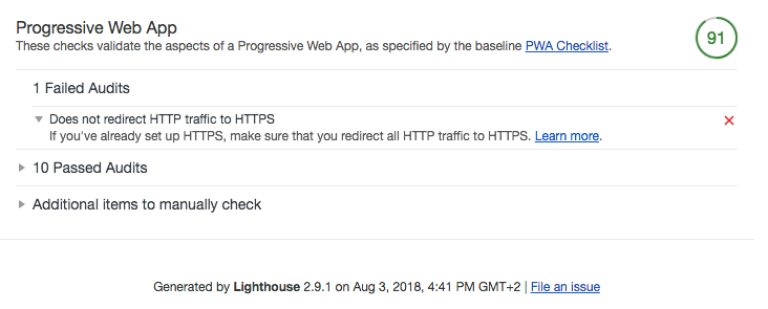
“Does not redirect HTTP traffic to HTTPS”
This will be solved once your app is correctly set up under HTTPS. Don’t worry that it fails on your localhost.
After implementing the suggestions above you should get a high score on your audit. Ideally, only the “no redirect to HTTPS” should fail when you’re on localhost.
Performance audits
Now we’re getting to the most exciting part of the audit - measuring your app’s performance.
You should never underestimate importance of performance. It’s easy to take your application speed for granted when you are sitting on 4G mobile network or 50mbps internet channel but keep in mind that more than half of the worldwide mobile users are still on either 2G or 3G, so there’s a high chance that your application will be launched on a slow network and it should be ready for that.
Another important thing to remember is that users will most likely leave your web site or close your application if it doesn’t load in about 3 seconds. You might, of course, get lucky with elderly users who won’t abandon your app simply because they fell asleep while waiting for it to load, but in general the rule is - the faster your app loads the happier your users are.
Which takes us to one of the most important performance metrics of Lighthouse - First Meaningful Paint. This is time passed from the moment user launched your app (or site) to the moment something useful appeared on the screen. As said before, you should keep this time to minimum, ideally less than 1 second.
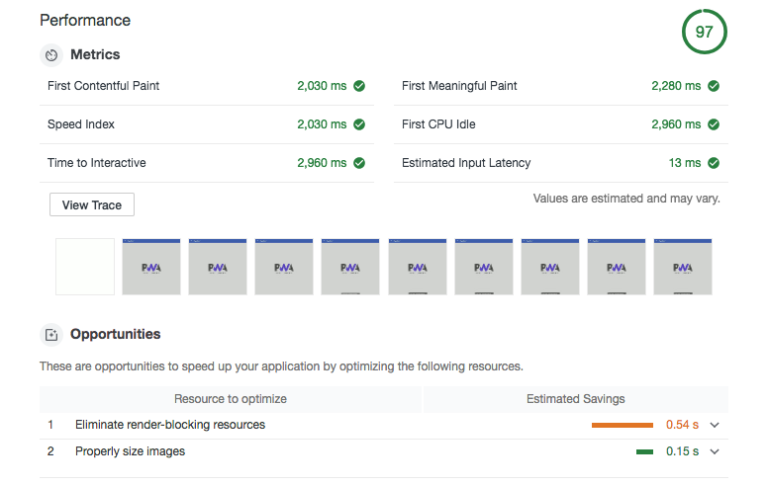
As you can see, there’s another metric on the screenshot called “First Contentful Paint”. These two are often mixed, but they are not the same. First Contentful Paint is the first moment when your app rendered ANYTHING on the screen (for example, a splash image) while the rest of the app is being loaded. First Meaningful Paint, however, is when your app rendered the primary content of the page.
There are several ways to decrease time elapsed before the first meaningful paint:
- Show static (or dynamic) visual element - spinner, progress bar, splash screen - while your app is being loaded
- Minimise load impact of application assets: minify javascript and CSS, optimise images (or - better - use SVG whenever possible), implement lazy loading and lazy rendering etc.
- Eliminate render-blocking resources
This last point is a very interesting and important issue, let's discuss it in more detail.
Render-blocking assets
It’s crucial that you, as a developer, understand how your application page is loading render-blocking assets which are usually scripts and links. Browser processes a page from the top down, and by default this processing is synchronous which means that every time browser encounters a <script> or <link> tag, it starts loading the resource referenced by this tag, blocking farther processing until this resource is loaded. You can change this default behaviour by adding async attribute to the <script> tag - references that are loaded asynchronously will load in parallel, significantly improving the total duration of the page load.
Keep in mind though that assets (Javascript, CSS, fonts) required for the rendering of the main page of your application or site should NOT be loaded asynchronously, otherwise it might happen that, for example, the page DOM is already loaded but browser is still loading that huge CSS file that should apply styling to the already rendered page elements, or that already rendered text suddenly changes its font.
So, how do you solve the issue with render-blocking resources? The answer is - by separating them into critical (required for the first page render) and non-critical (all the rest). Critical CSS and JS should be loaded synchronously, or maybe even inlined into the page’s HTML. Non-critical resources can be loaded asynchronously or even deferred with defer attribute meaning that they will be loaded after the page is done loading.
For even finer tailoring you can create responsive stylesheets for specific device parameters (like orientation, width etc.) - this is done using media attribute on the <link> tag, usually making it non render blocking.
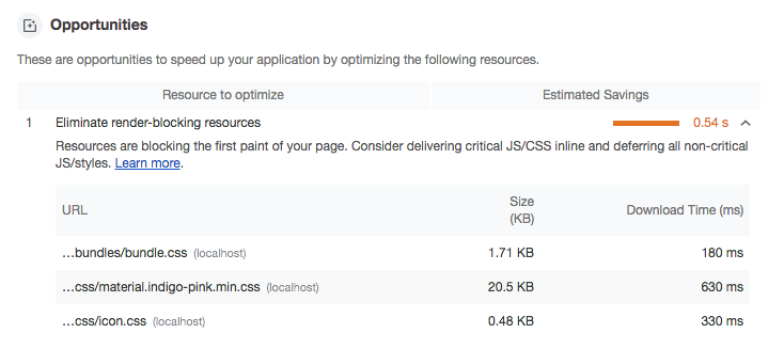
As you can see on the screenshot above, Lighthouse is not happy with render-blocking stylesheets in my app.
One way to solve this is to use rel=“preload” attribute on <link> elements. Two issues with this approach: a) you have to use load event handler on each element to change the value of rel attribute from “preload” to “stylesheet” after it’s loaded, b) rel=“preload” is not yet supported by all browsers (although several polyfills exist). This article describes the best practices of asynchronous CSS loading very well.
Another trick that I used for my apps, is to inline critical styles and then, after the page is loaded, remove the inline styles and inject stylesheets. The code snippet is shown below:
<html>

<head>

…

  <style>
    // My critical styles are inlined here
    …

  </style>

</head>


<body>

  ...


<script type="text/javascript">


  let cssLoaded = 0;

  let cssAdded = 0;


  const removeInlineStyles = function() {

      const styleEl = document.getElementsByTagName('style')[0];

      styleEl.parentNode.removeChild(styleEl);

  };


  function addLinkElementToHead(src) {

      const link = document.createElement('link');

      link.setAttribute('rel', 'stylesheet');

      link.setAttribute('type', 'text/css');

      link.setAttribute('href', src);

      link.onload = () => {

          cssLoaded++;

          if (cssLoaded === cssAdded) {

              removeInlineStyles();

          }

      }

      document.getElementsByTagName('head')[0].appendChild(link);

      cssAdded++;

  }


  addLinkElementToHead(´bundles/bundle.css´);

  addLinkElementToHead(´precache/css/material.indigo-pink.min.css´);

  addLinkElementToHead(´precache/css/icon.css´);

</script>

</body>

</html>
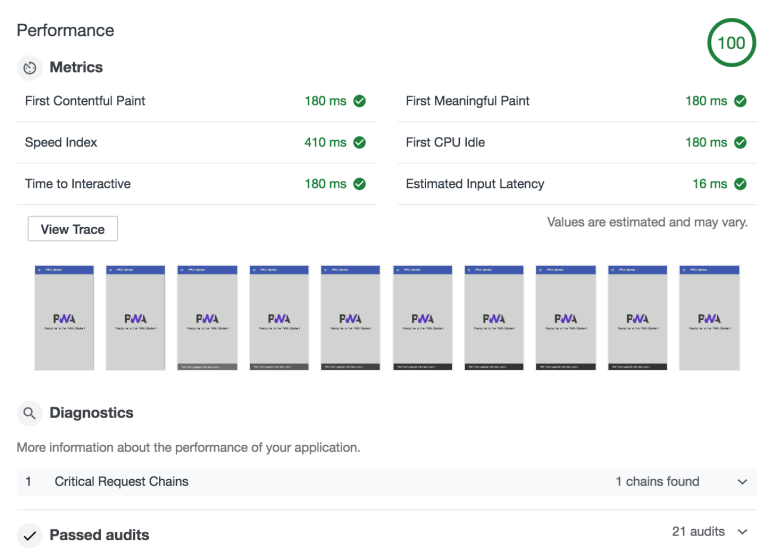
Critical styles are inlined inside <style> tag of the <head>. Once the page processor gets to the bottom of the page, it will execute the script with a batch of addLinkElementToHead functions which inject stylesheets required by the page. Once the last of them is injected, the inline styles are removed (if we remove inline styles before injection, users on slow networks might notice flickering).
This speeds up both First Contentful Paint and First Meaningful Paint to whopping 180ms, which finally makes Lighthouse happy with my app and it graciously gives me 100 score in the “Performance” category.
Conclusion
We discussed the most important audits from the Performance category of Lighthouse but there are plenty of others (check out the Lighthouse site for more info). Most of them serve the same purpose of minimising the time elapsed to the moment your application rendered some useful content, which only proves how important it is to make sure your baby is quick to engage a potential long-time user and keep him/her interested throughout the entire interaction session via fast, responsive and user-friendly interface.
Performance profiling and metrics are often complex and usually tend not to have very friendly UX - anyone who worked with profiler in Chrome Dev Tools would know that - but the Lighthouse team managed to get this just right.
The only issue I currently have with Lighthouse - at least with the Dev Tools version of it - is that it doesn’t seem to be able to throttle slow network when the browser is offline, or even when connected via hotspot. I’m sure there are reasons for that although I don’t see why being online should matter when I’m developing a local PWA and want to audit its performance.
Other than that, it’s safe to say that Lighthouse developers created a very helpful, user-friendly tool which not only will find issues - sometimes very well hidden! - in your application but will also help you fix them. So, if you are aimlessly wandering about in the vast oceans of uncertainty about the quality of your work, don’t hesitate to direct your ship towards this lighthouse, it’s definitely worth checking out!